That equity curve is one of thousands it could have been
Enter your win rate, your reward-to-risk ratio, and the fraction you risk per trade. This draws thousands of equity curves the same system could have produced. The clean line in a backtest — where does it sit in that spread?
Take-profit as a multiple of the stop. 1:2 means "2"
Share of current equity lost on a losing trade
Common settings
Median final balance
—USD
Chance of ending below start—
Median max drawdown—
Chance of a 50%+ drawdown—
Median
5th to 95th percentile
Starting balance
——
Kelly-optimal risk —
Expectancy per trade — (per unit of risk)
The spread of possible equity curves, in pictures
Why one curve is not enough
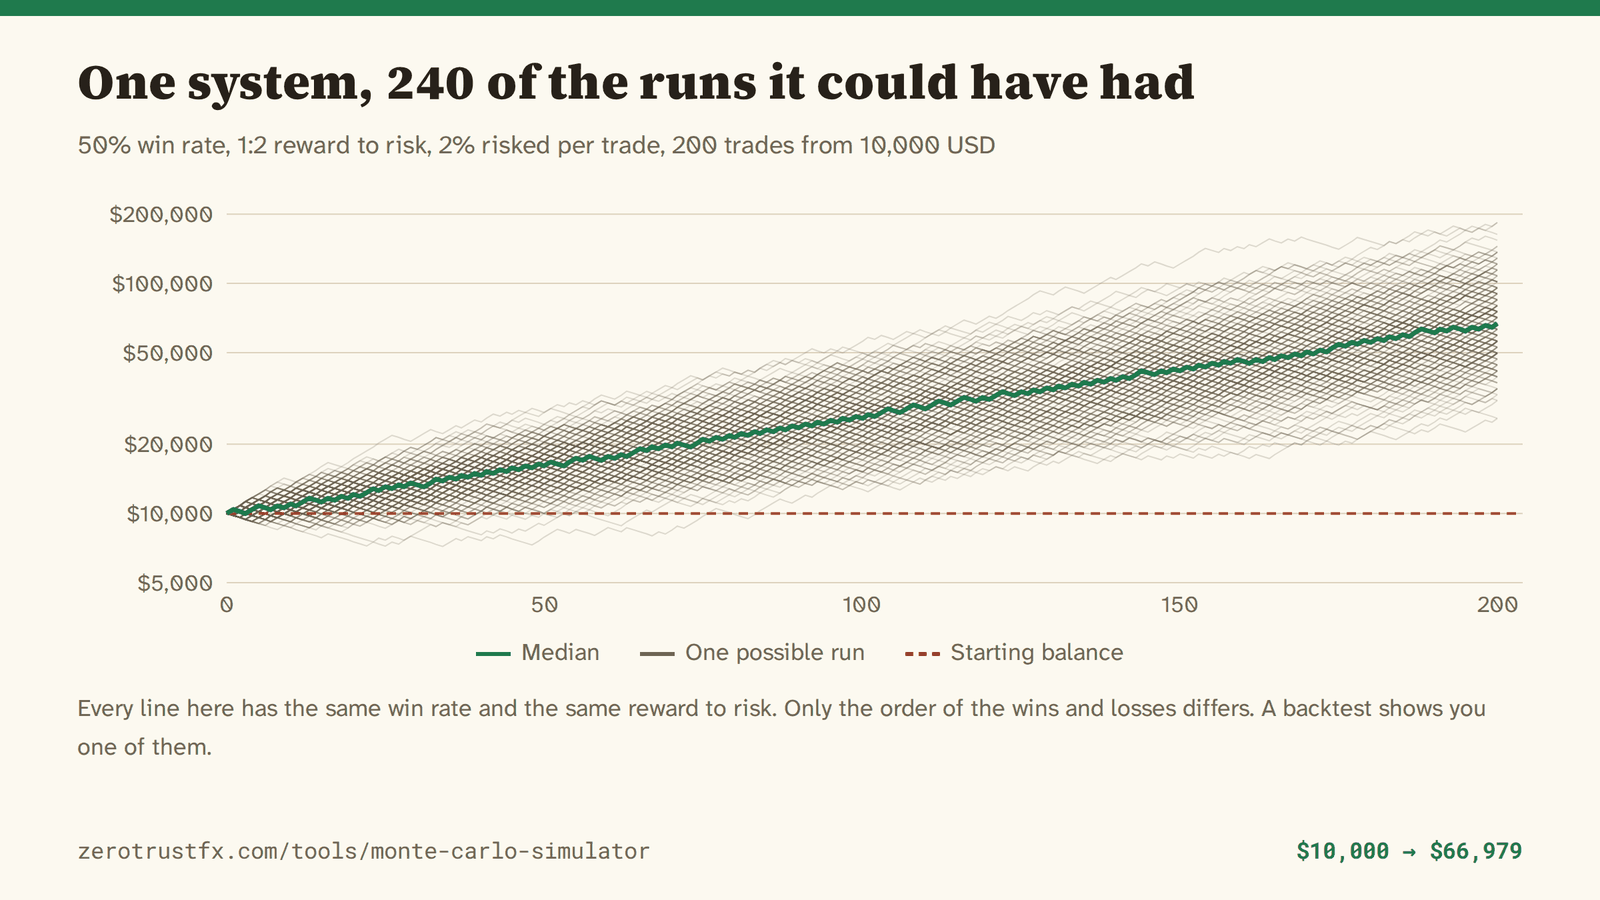
A backtest, or the equity curve somebody shows you, is the one run that happened. With the same win rate and the same reward-to-risk, a different order of wins and losses produces a completely different shape.
In the chart above, every thin line is a life that could have happened. Picture thousands of people running the same system for the same number of trades, all their results laid on top of each other. The thick line is the middle of them.
The width of that spread is the range of outcomes available to you. Judging a system by a line near the top of it is like judging a lottery by interviewing the winners.
Positive expectancy does not mean it grows
This is the thing this simulator shows most clearly.
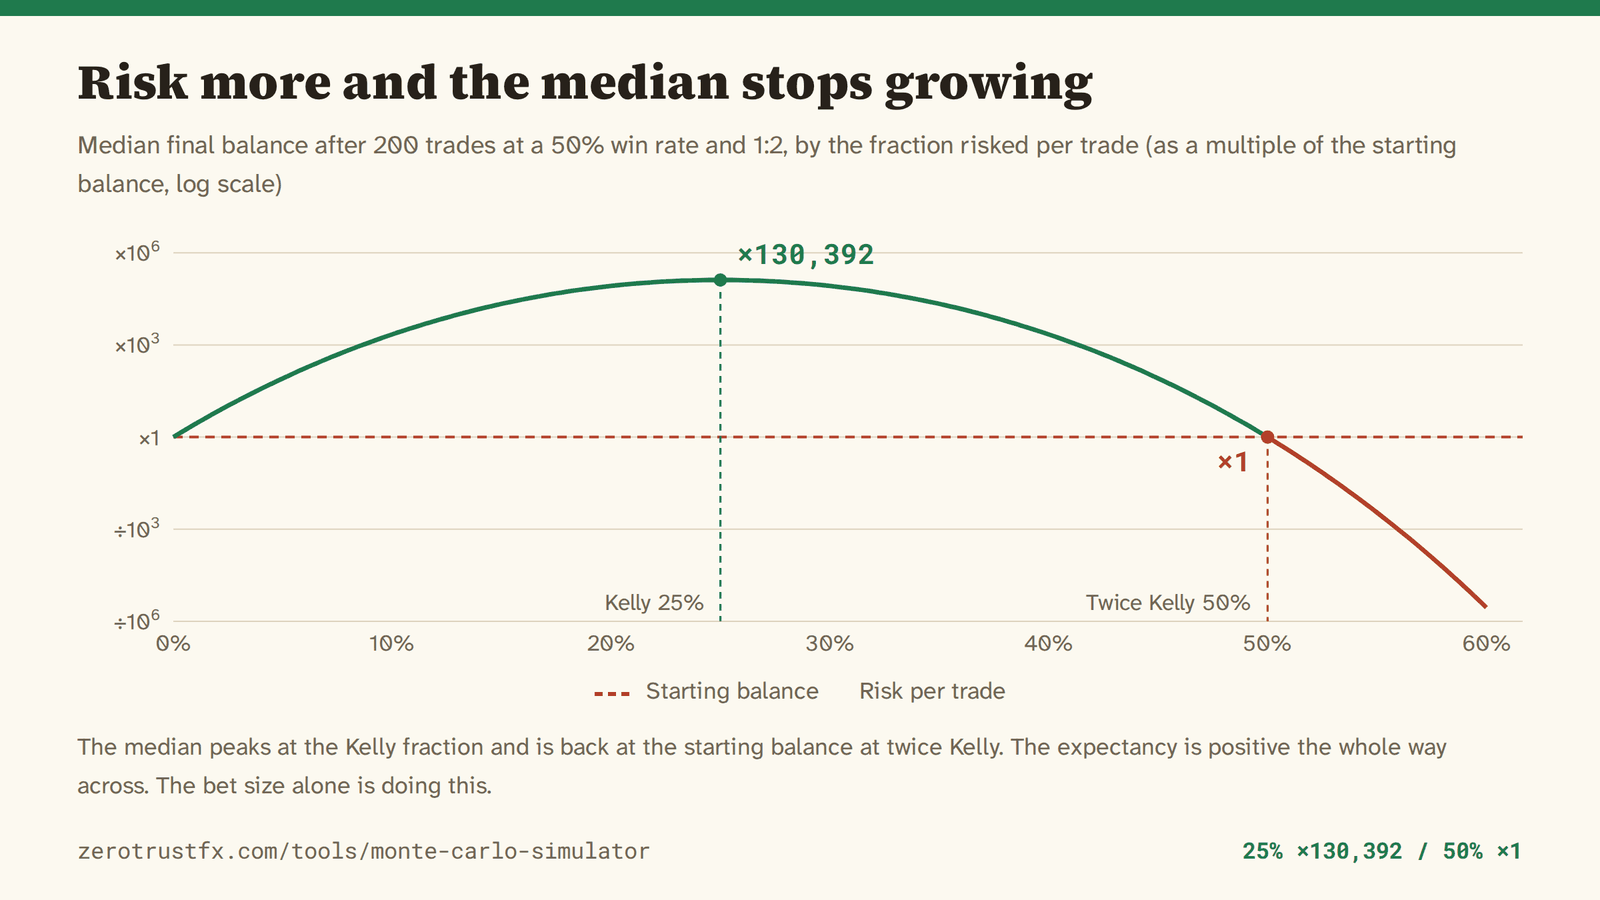
A 50% win rate at 1:2 is a real edge. The expectancy is +0.5 per unit risked. And yet changing only the fraction you bet changes the outcome completely.
There is an optimal fraction, called the Kelly fraction. Here it is 25%. And at twice that — 50% — two hundred trades move the median by nothing at all.
That is not a coincidence. Work out the log growth per trade and you get 0.5·ln(2.0) + 0.5·ln(0.5) = 0, exactly zero. It is the point where the winning multiplier and the losing multiplier cancel.
So "it has positive expectancy, so it makes money over time" says nothing until you have fixed the bet size.
Sometimes the average return is a meaningless number
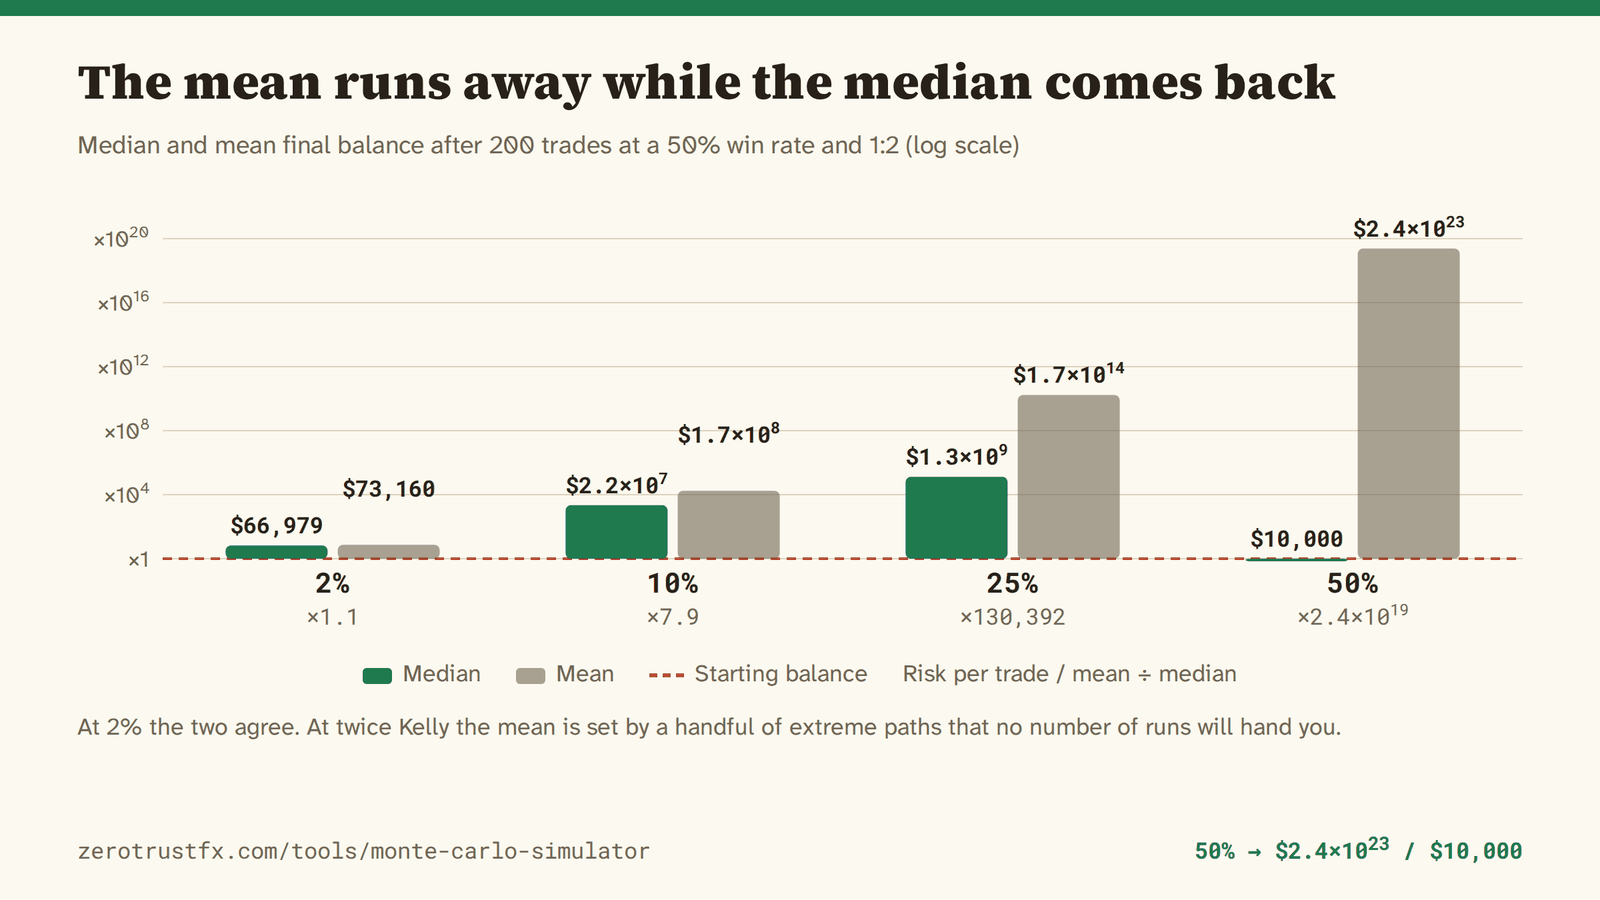
For that twice-Kelly setup, the theoretical mean works out to 2.4×10²³ USD. Draw ten thousand actual runs and the average of them is 2.6×10¹⁶ USD — about nine million times smaller.
The gap is the point. The mean is set by freak winning paths so rare that ten thousand draws never produce one. A handful of absurd values drag up a number almost nobody reaches.
In that regime the mean is not a usable statistic. When you see "average annual return", ask what the median was. If nobody can tell you, the number promises nothing.
What this model assumes
It assumes the win rate and reward-to-risk hold for every trade. Markets change. A system that won 55% of the time last year is not promised to do it again. This is a "what if nothing changes" picture.
It assumes each trade is independent. In practice losing streaks cluster, because market conditions persist. Assuming independence makes the spread here narrower than reality.
It ignores slippage, spread widening, rejected fills and swap. All of those push results the same direction — down. Read these numbers as slightly better than what you would get.
It assumes your stop always fills. Gap through it once and a single loss is larger than planned, which breaks the fixed-fraction assumption the whole model rests on.
The arithmetic
Win: E ← E × (1 + f·R) / Loss: E ← E × (1 − f)
Log growth per trade = p·ln(1 + f·R) + (1 − p)·ln(1 − f)
Kelly-optimal f = ( p·(R + 1) − 1 ) ÷ R
Median = starting balance × exp( trades × log growth )
If you want to run this setup
The arithmetic above is the same at any broker. Spread and fill quality, though, move the result one direction only — worse. The trading record published on this site is an Exness account.
※ This is an affiliate link: I earn a commission if you open an account through it, fund it and actually trade. That commission and a planned performance fee on a future copy-trading service are this site's only revenue — there is nothing else. Trading with leverage carries the risk of losing your money.
Frequently asked questions
What is a Monte Carlo simulation?
Running the same setup thousands of times with fresh random draws to see the distribution of possible outcomes rather than a single one. A backtest shows you one curve; this shows you thousands at once.
Why does it draw the same picture every time?
The random numbers come from a seed. If the picture changed on every click, anyone opening your shared link would see something else and a screenshot could never be reproduced. Press "Re-draw" for a different draw — the seed number changes with it.
What is the Kelly fraction?
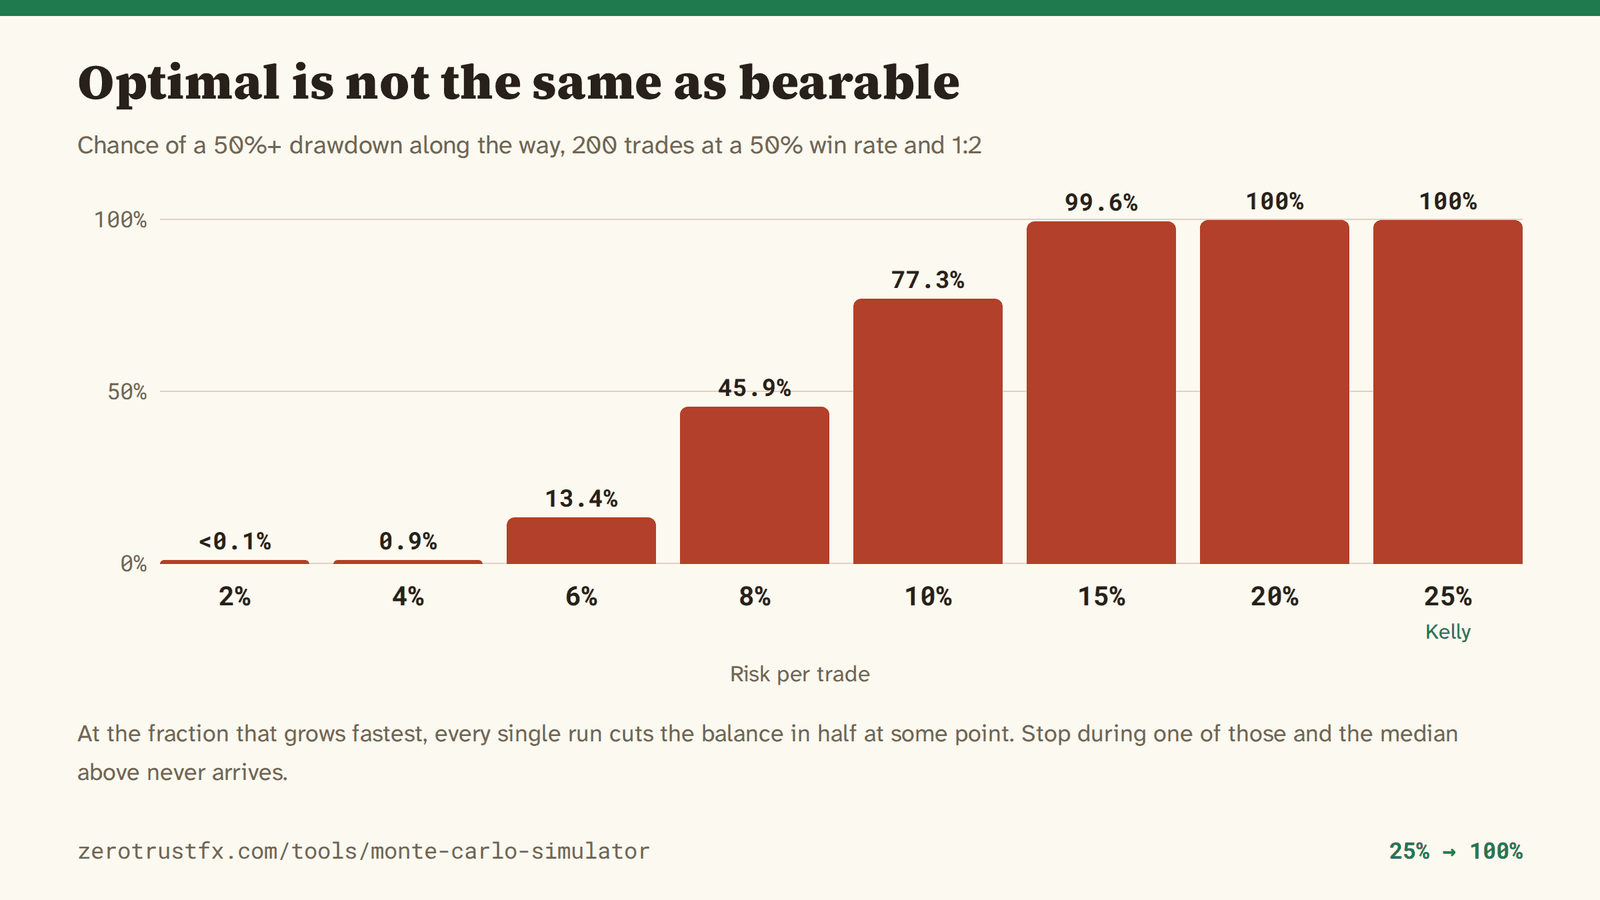
The share of your balance per trade that maximises long-run growth: ( win rate × (R+1) − 1 ) ÷ R. At a 50% win rate and 1:2 it is 25%. Almost nobody actually risks that much — the drawdowns along the way are unbearable.
How can expectancy be positive while the median does not grow?
Because losses compound multiplicatively. Losing 50% needs a 100% gain to undo. The larger the fraction you bet, the harder that asymmetry bites, until the winning and losing multipliers cancel exactly. That point is twice the Kelly fraction.
Should I look at the mean or the median?
The median. It is where you are most likely to land. When the bet size is large the mean is dragged around by a few freak paths and becomes a number nobody reaches.
Does the number of runs change the answer?
The median and the drawdown distribution get more stable as runs increase. This page takes its statistics from 2,000 runs and draws only 240 of them — drawing all of them turns the chart into a solid block.
How many trades should I enter?
However many you actually take in the period you care about. A few hundred a year for day trading, a few dozen for swing trading. More trades moves the median and widens the spread.
Why is the median positive when so many runs end below the start?
The distribution is not symmetric. Multiplicative returns are unbounded above and floored at zero below, so the typical shape is "most lose a little, a few win a lot".
Can I use these numbers to size my own trading?
No. The model assumes a fixed win rate, independent trades, and no slippage or swap. None of those hold. Treat the output as slightly better than reality.
How do I enter the reward-to-risk ratio?
It is your take-profit divided by your stop. A 50 pip stop with a 100 pip target is "2". A 100 pip stop with a 50 pip target is "0.5". If you want the win rate you would need instead, use the forex risk-reward calculator.
How long do losing streaks run?
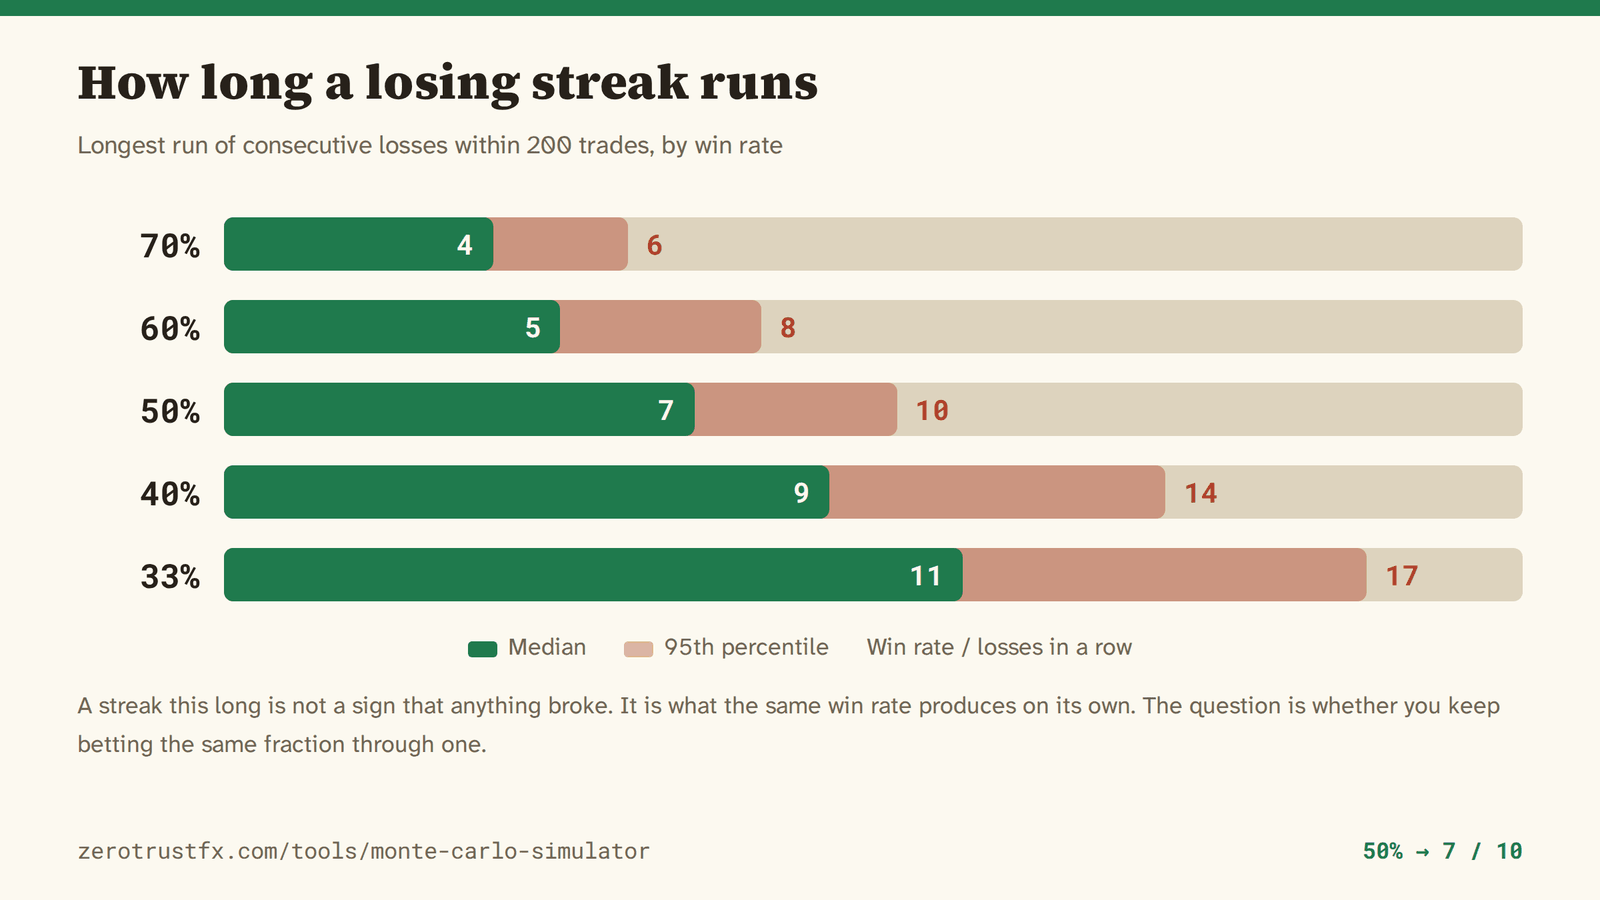
At a 50% win rate over 200 trades, the longest losing streak is 7 in the median case, and one run in twenty contains a streak of 10 or more (40,000 trials). At a 40% win rate the median is 9 and the top 5% see 14. Streaks are not an anomaly. The question is whether you keep betting the same fraction through one.
What if I trade a fixed lot size instead?
This models fixed fractional sizing - a percentage of your current balance each time. With a fixed lot the stake does not shrink as the account does, so the chance of ruin goes up, while the upside compounds more slowly. The intuition that fixed lots are safer is backwards.
Does this replace a backtest?
No. A backtest uses the order prices actually moved in. This uses only your win rate and reward-to-risk and reshuffles the order at random. Measure the win rate with a backtest, then come here to see what that win rate can produce. They answer different questions.
How much gain does it take to recover a drawdown?
A 20% loss needs 25%, a 30% loss needs 43%, a 50% loss needs 100%, a 90% loss needs 900%. Losses compound and so do recoveries, so the deeper it goes the faster it gets worse. That asymmetry is exactly why raising the bet size lowers the median.
What if I do not know my win rate?
Start recording. Without a record there is no number to type in. And be careful: a win rate from a small sample tells you very little. Thirty trades at 50% puts the true rate somewhere between 32% and 68% (95% interval). Enter both ends here and see how much the conclusion moves.
Check this against a real record
Arguments about variance are unconvincing on paper. ZeroTrustFX publishes every trade before its outcome is known, cross-checked by an independent third party. Go and see where one real curve sits inside this spread.
※ This is an affiliate link: I earn a commission if you open an account through it, fund it and actually trade. That commission and a planned performance fee on a future copy-trading service are this site's only revenue — there is nothing else. Trading with leverage carries the risk of losing your money.