How many days before compounding shows up
Put in a starting balance and an annual rate and the chart shows how far it grows and how long that takes. Set a withdrawal level and you also see how often you could draw down while keeping the same max leverage.
Withdrawals
Withdraw when equity touches this. Under 30,000 keeps 1:2000 at Exness
Set 0 to compound without withdrawing
Common setups
Days to the withdrawal level
—days
Withdrawals in the period
—
Total withdrawn
—
Equity at the end
—
Equity
Total withdrawn
Withdrawal level
Share on social
What compounding is actually doing
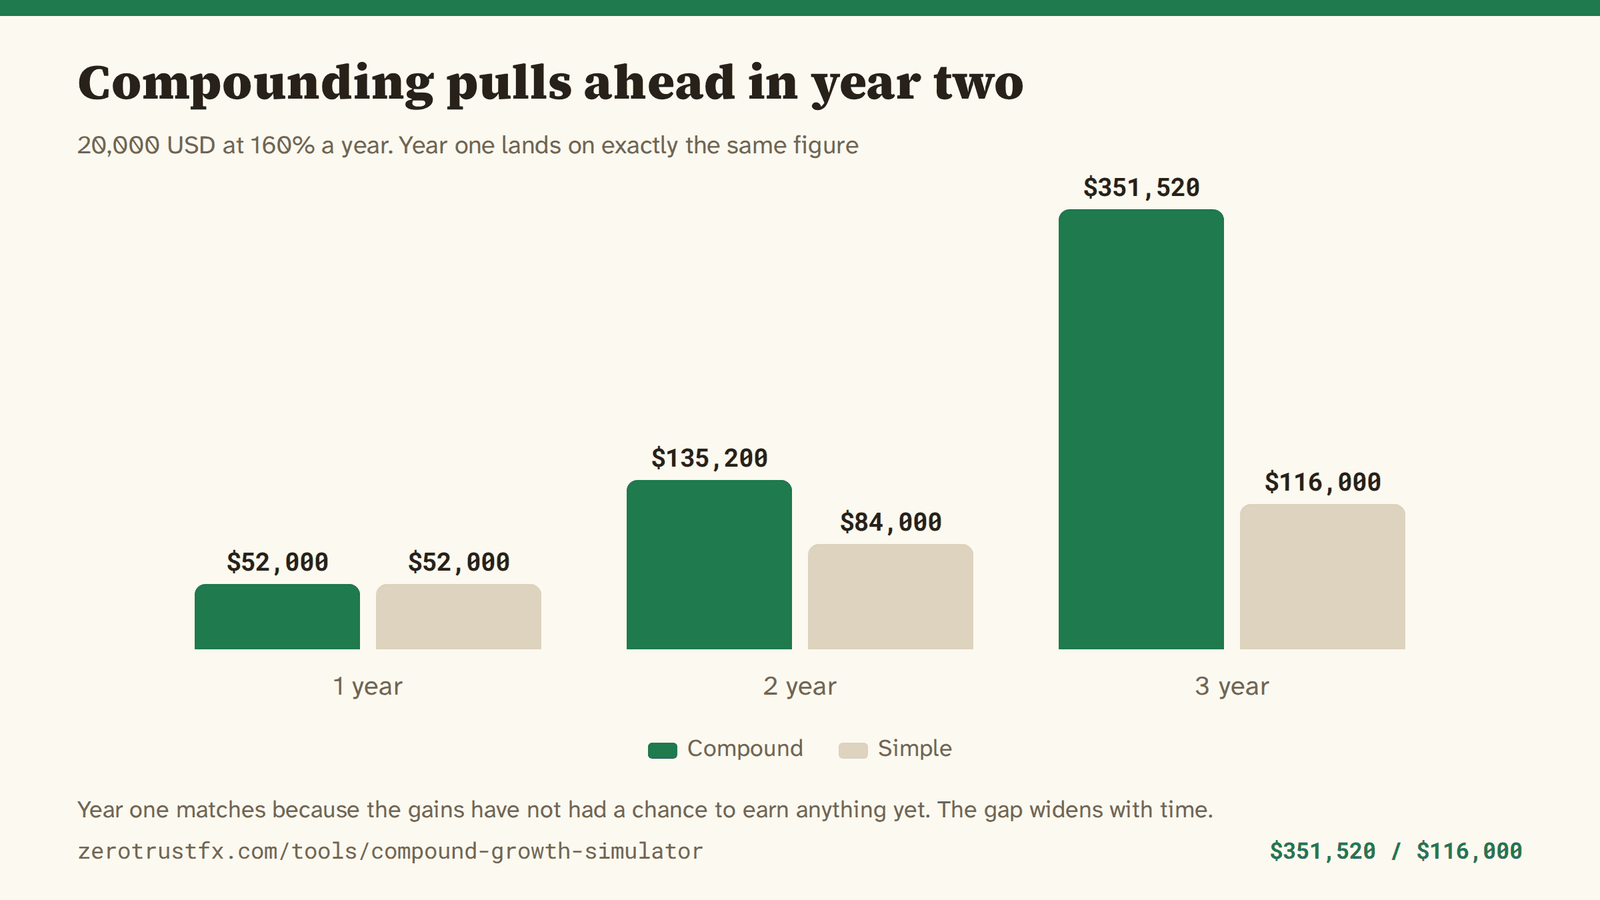
Compounding just means the gains earn gains too. Spread 160% a year — 2.6× — across 252 trading days and a single day is worth 0.38%. That smallness is what compounding really is.
It shows up late. 20,000 takes about 98 trading days to reach 29,000; from there to 40,000 takes about 85. The amount added per day grows, but the rate is the same throughout.
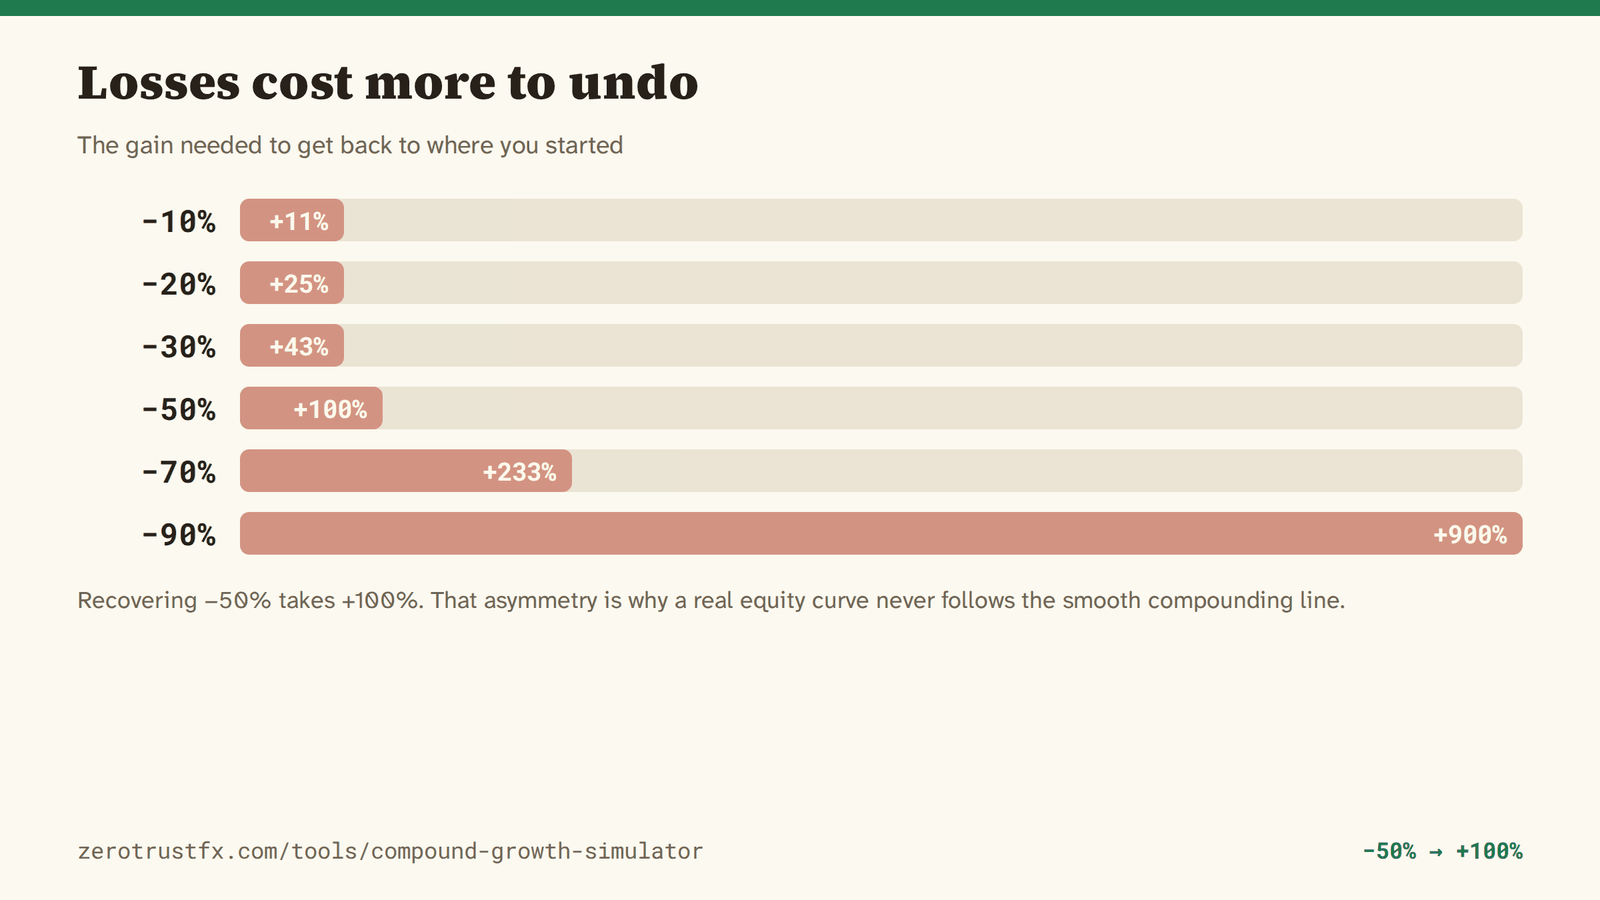
The same arithmetic runs backwards. Recovering a 50% loss needs a 100% gain. That asymmetry is why a real equity curve never looks like the line above — the chart draws one path where every day gains exactly the same percentage.
Compounding and max leverage in pictures
Max leverage, and the case for withdrawing
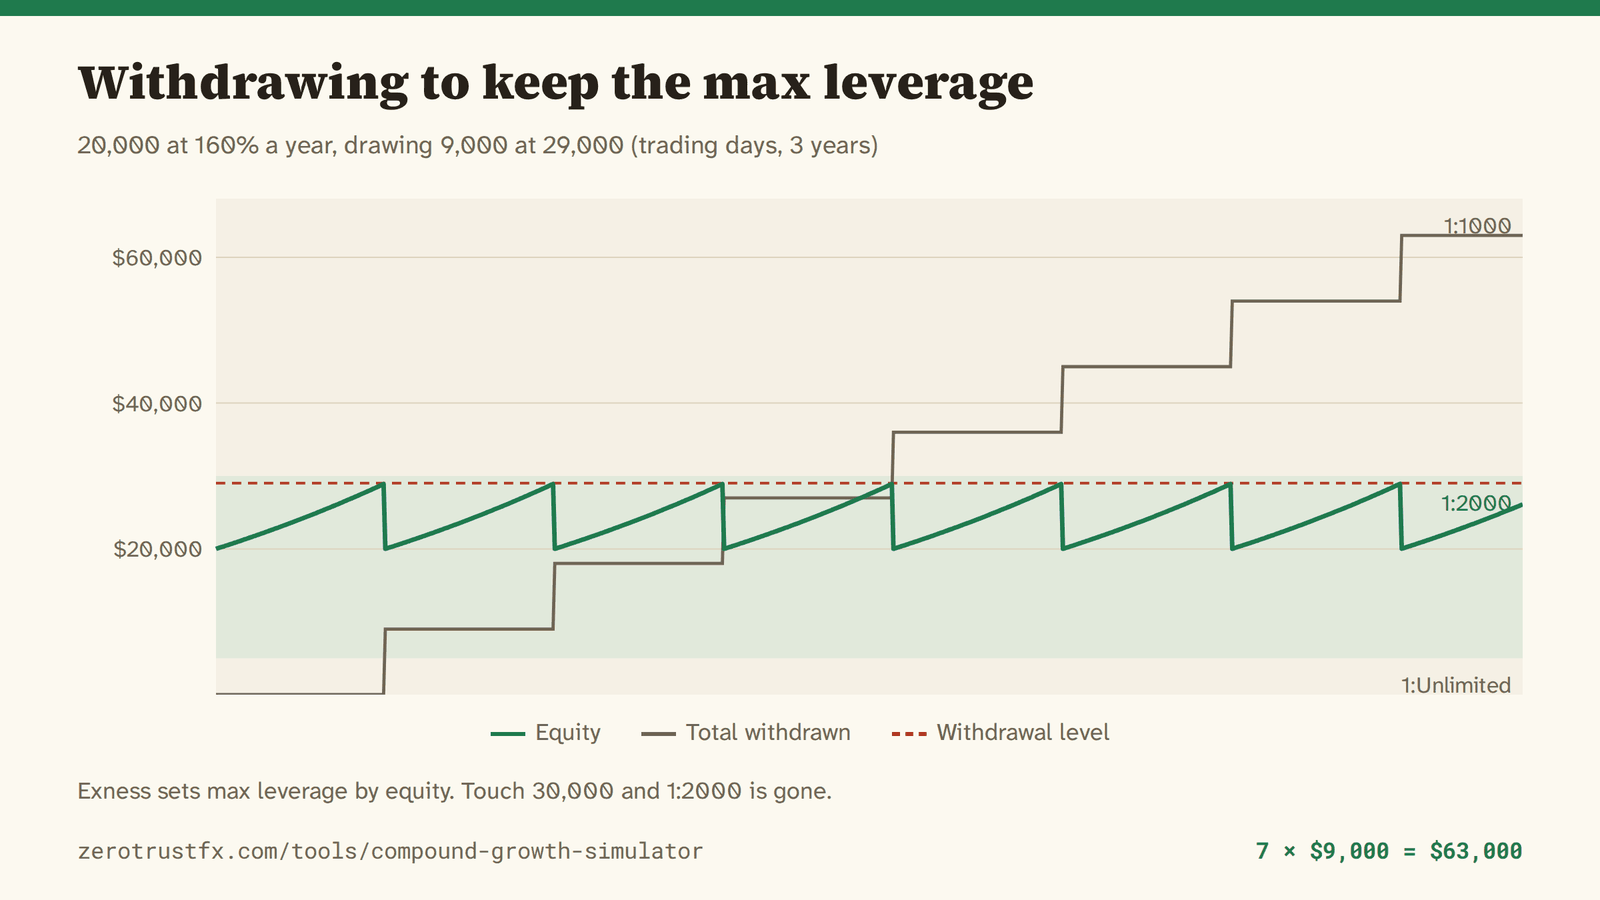
Exness sets the maximum leverage from your equity. At 30,000 USD it drops from 1:2000 to 1:1000, and at 100,000 to 1:500. It moves back up when equity falls, which is what makes withdrawing to keep the higher max leverage possible at all.
★It is equity, not balance. Open profit counts. A 28,000 balance carrying 3,000 of unrealised profit is treated as 31,000 and is on 1:1000 already. Watching the balance alone puts you a day late.
Setting the withdrawal level to 29,000 leaves a little room under the ceiling for 1:2000 (29,999.99), which is why it is the default here.
| Equity | Maximum leverage |
|---|---|
| 0 – 4,999.99 | Unlimited (conditions apply) |
| 5,000 – 29,999.99 | 1:2000 |
| 30,000 – 99,999.99 | 1:1000 |
| 100,000+ | 1:500 |
Source: Exness Help Centre (Leverage / Unlimited leverage). These are the broker's rules and can change.
These limits are an Exness account
The maximum leverage above is Exness's. If you want to test the same conditions, you can open an account here.
※ This is an affiliate link: I earn a commission if you open an account through it, fund it and actually trade. That commission and a planned performance fee on a future copy-trading service are this site's only revenue — there is nothing else. Trading with leverage carries the risk of losing your money.
The inconvenient parts, first
The rate is an assumption, not a forecast. This tool only answers "how many days if it grows exactly like that". Nothing here justifies the 160%.
More leverage does not raise expected value. It raises the position size you can open and lowers the distance to a margin call. With the same method, higher leverage means running out of money sooner. Holding 1:2000 does not make results better.
A real curve does not look like this. No losing streaks, no spread widening, no slippage on news. The only thing in here is the assumption of a constant rate.
What ZeroTrustFX publishes is not this kind of assumption but the actual orders, posted before their outcome. Keep the two apart.
The arithmetic
annual rate = (1 + monthly rate) ^ 12 − 1 (only when entered per month)
rate per step = (1 + annual rate) ^ (1 / steps per year) − 1
balance = previous balance × (1 + rate per step)
withdrawal = subtract the fixed amount on the day equity touches the level
Common questions
How long does 20,000 USD take to reach 29,000 at 160% a year?
About 98 trading days on a 252-day year — roughly 4.6 months. On a 365-day year it is about 142 days. The difference is whether a day is worth 0.38% or 0.26%.
Does "160% a year" mean 2.6× or 1.6×?
Here it means 2.6× — the balance grows by 160% over the year. If you want 1.6×, enter 60%.
Should I use trading days or calendar days?
Currencies do not move at the weekend, so trading days (252) is closer to how an account actually behaves. Calendar days is easier if you want to know how many days since you funded the account. The same rate always takes more calendar days than trading days.
What is the formula?
Rate per step = (1 + annual rate) ^ (1 / steps per year) − 1. At 160% over 252 days that is 2.6^(1/252) − 1 = 0.0038, or 0.38% a day. After that it is just multiplication, once per day.
Why withdraw at 30,000?
Because Exness drops the maximum leverage from 1:2000 to 1:1000 once equity reaches 30,000 USD. Drawing down near 29,000 keeps you inside the 5,000–29,999.99 range where 1:2000 is available.
Why equity rather than account balance?
Because that is what Exness measures. Equity is the balance plus open profit and loss, so a 28,000 balance holding 3,000 of unrealised profit counts as 31,000 and is already on 1:1000.
Does leverage come back after a withdrawal?
Yes. The limit applies dynamically in both directions, so once equity is back under 29,999.99 USD 1:2000 is available again. This simulator assumes exactly that.
Is higher leverage better?
No. Leverage changes the position size you can open and the distance to a margin call. It does not move expected value at all. With the same method, more leverage means running out of money sooner.
What happens if I withdraw a larger amount each time?
The cycles get longer. The smaller the base you restart from, the bigger the multiple needed to get back. Taking 9,000 at 29,000 leaves 20,000, so every cycle is 1.45× and about 98 trading days. Taking 18,000 leaves 11,000, which needs 2.64× and about 256 trading days.
What annual rate is realistic?
This tool has no opinion — the rate is your assumption. If you want something to judge it against, use a trading record that was published before its outcome, not an advertisement.
Is there a quick way to estimate doubling time?
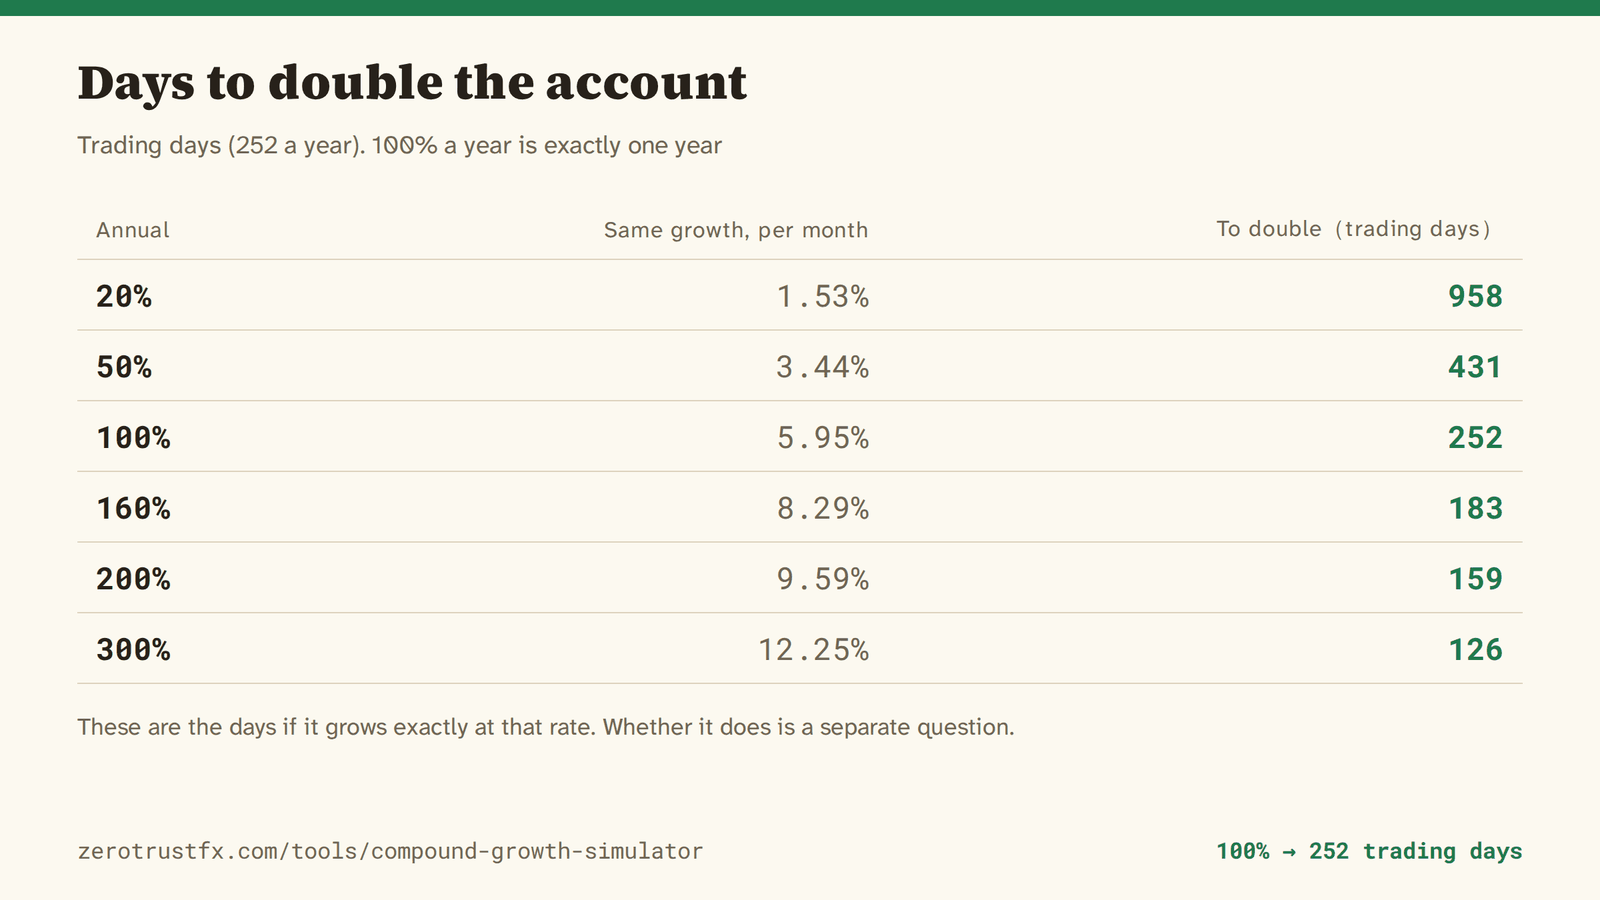
The rule of 72: 72 ÷ the rate per step (%) is roughly the number of steps to double. At 0.38% a day, 72 ÷ 0.38 ≈ 190 trading days. The exact figure is about 183, so it is close enough for a sanity check.
How do drawdowns affect compounding?
Asymmetrically. Recovering −50% needs +100%; recovering −20% needs +25%. This simulator draws one smooth path at a constant rate, so no losing streaks are in it. A real curve is always rougher than this.
Are withdrawal fees and processing time included?
No. The full amount is subtracted on the day it is triggered. In practice fees and processing days shift the picture a little.
What does this simulator guarantee?
Nothing. It answers "how many days, if the money grows exactly at the rate you typed". It says nothing at all about whether it will.
How do I convert a monthly rate to an annual one?
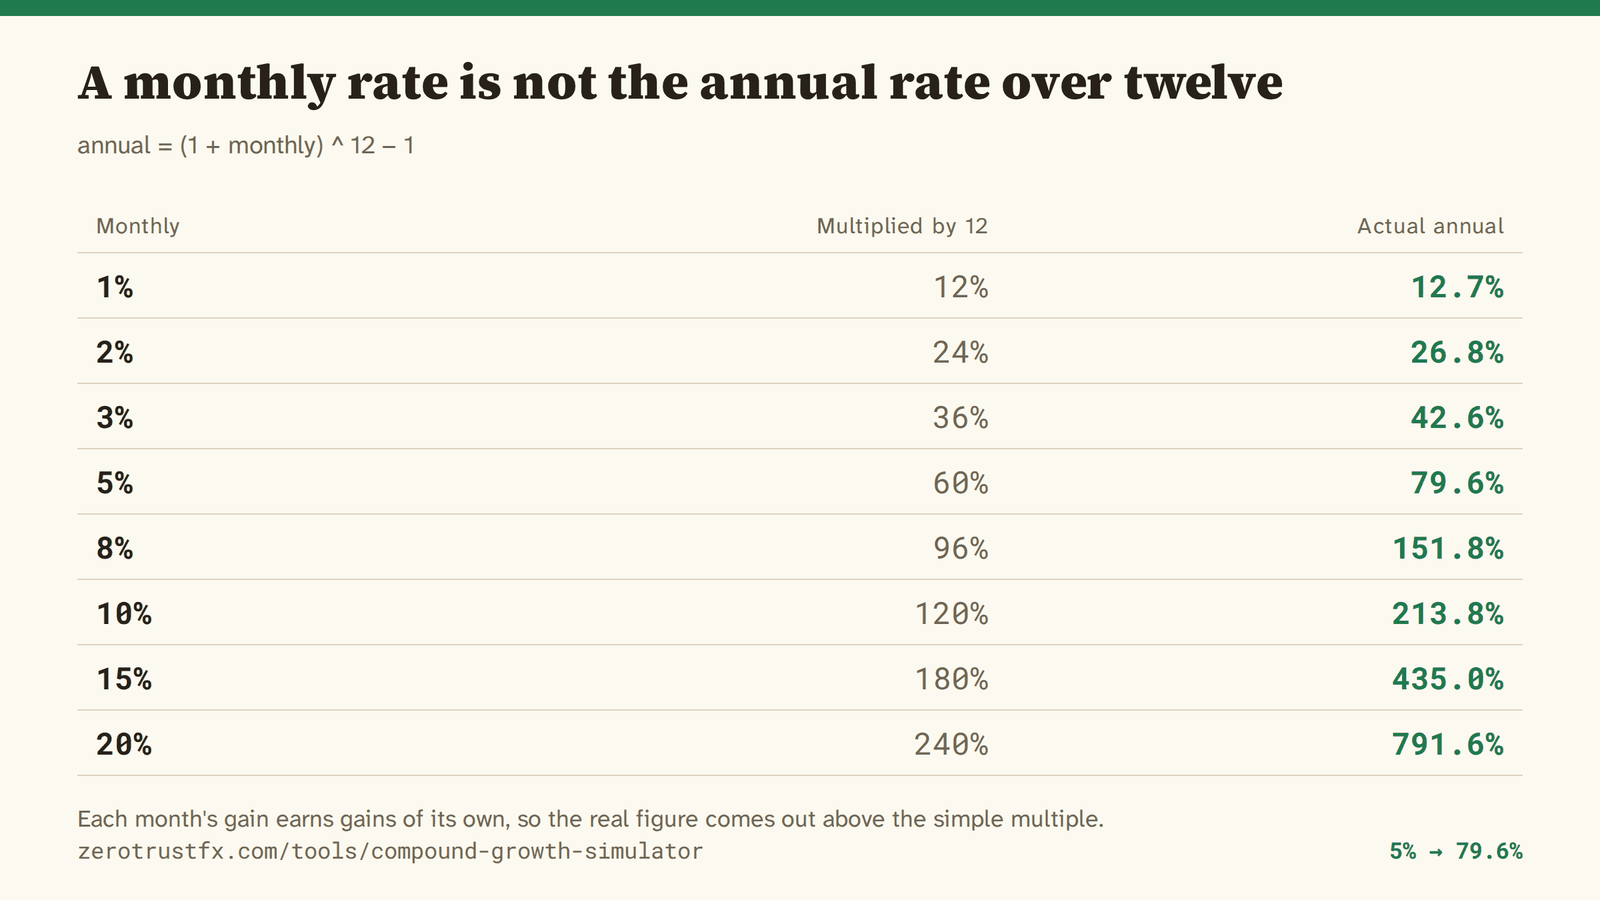
Annual = (1 + monthly) ^ 12 − 1. It is not 12 times the monthly figure: each month's gain earns gains of its own, so the annual number comes out higher. Switching the unit in this simulator converts the number for you, so you can read the equivalent straight off the button.
What is 5% a month as an annual rate?
About 79.6% (1.05 to the twelfth is 1.796) — not the 60% you get by multiplying by 12. 10% a month is about 213.8% a year; 3% a month is about 42.6%.
Can the maximum leverage rules change?
Yes. They are the broker's rules, so both the amounts and the ratios can be revised. Check the Exness Help Centre for the current terms before acting on anything here.
Check this against a real record
A compounding chart is one smooth path drawn from an assumption. ZeroTrustFX publishes every trade before its outcome is known, cross-checked by an independent third party. Look at the part that is not an assumption.
※ This is an affiliate link: I earn a commission if you open an account through it, fund it and actually trade. That commission and a planned performance fee on a future copy-trading service are this site's only revenue — there is nothing else. Trading with leverage carries the risk of losing your money.